NEP Training and Prediction
The train, prediction, train_density, and parity_density plots also
print a terminal table containing R^2, MAE, and RMSE for energy, force, and
stress. If no valid stress rows are available, the stress entries are N/A.
train (plt_train.py)
Visualizes NEP training progress including loss curves, RMSE evolution, and parity plots comparing DFT vs NEP predictions for energy, forces, and stresses.
Input Files: loss.out, energy_train.out, force_train.out, and either
stress_train.out (preferred) or virial_train.out
gpumdkit.sh -plt train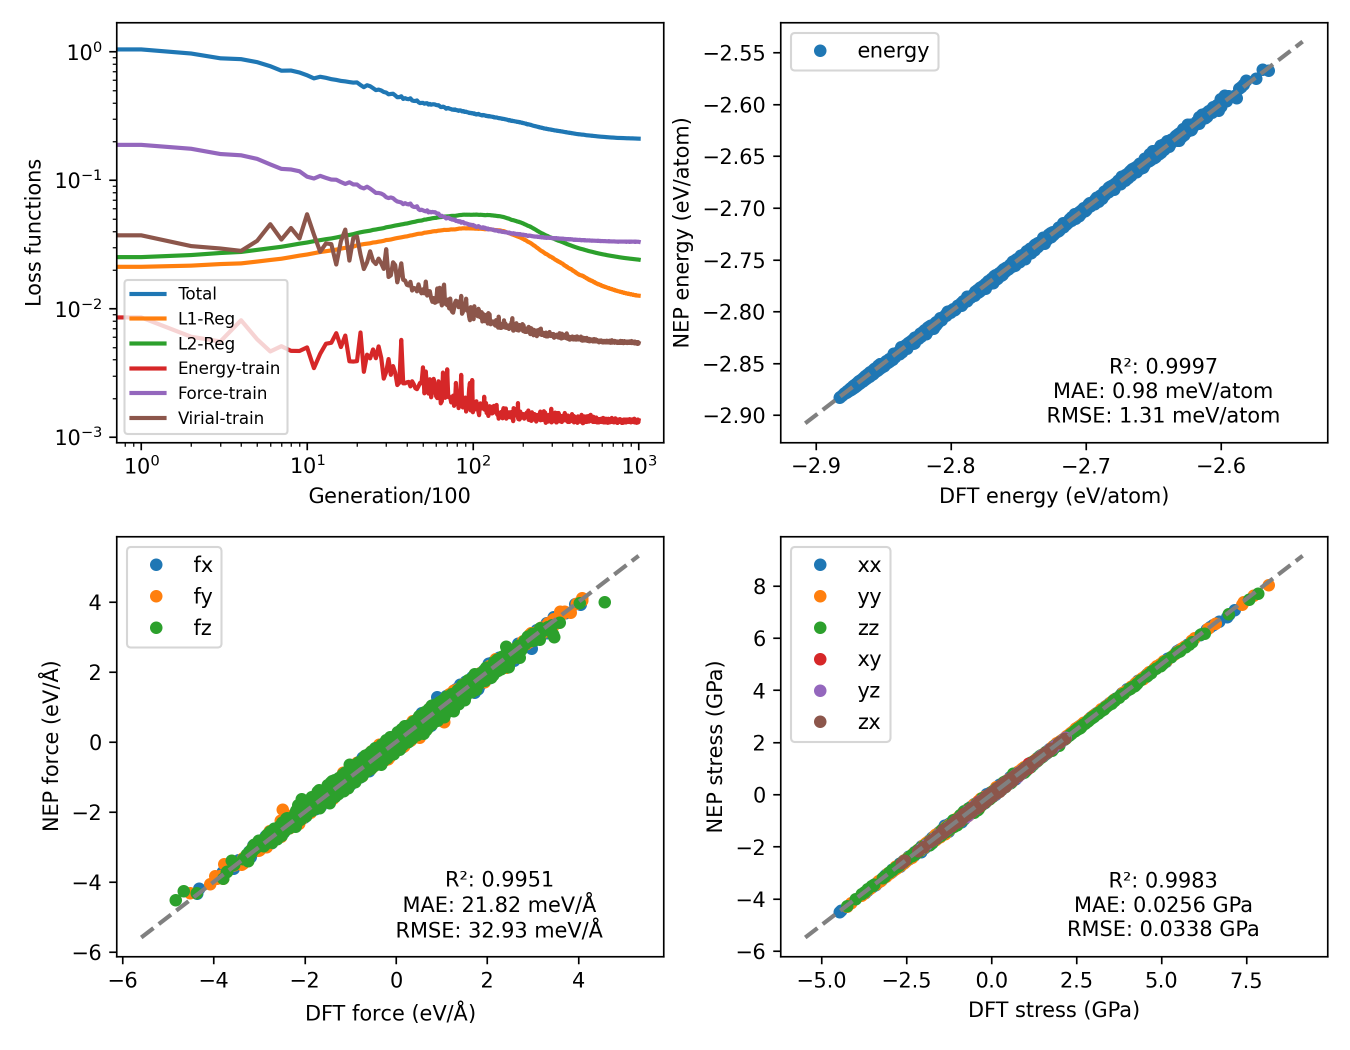
prediction (plt_prediction.py)
Visualizes NEP prediction-mode results for the structures in train.xyz.
Prediction mode still writes the parity data to files ending in _train.out.
Input Files: energy_train.out, force_train.out, and either
stress_train.out (preferred when it contains valid rows) or virial_train.out
gpumdkit.sh -plt prediction
gpumdkit.sh -plt test         # Alternative command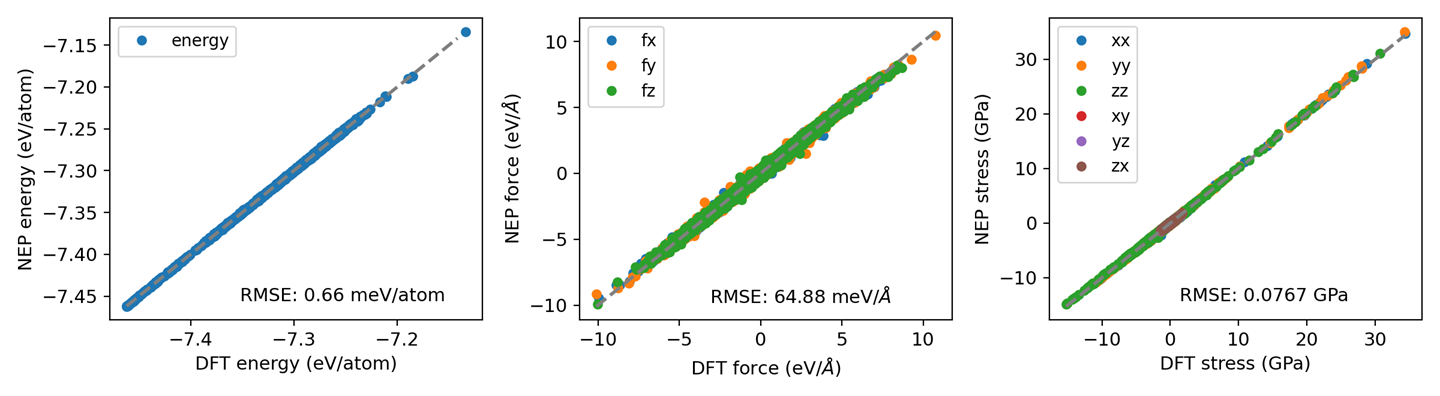
train_test (plt_train_test.py)
Creates combined parity plots for both training and testing datasets.
Input Files: energy_train.out, force_train.out, stress_train.out,
energy_test.out, force_test.out, and stress_test.out
gpumdkit.sh -plt train_test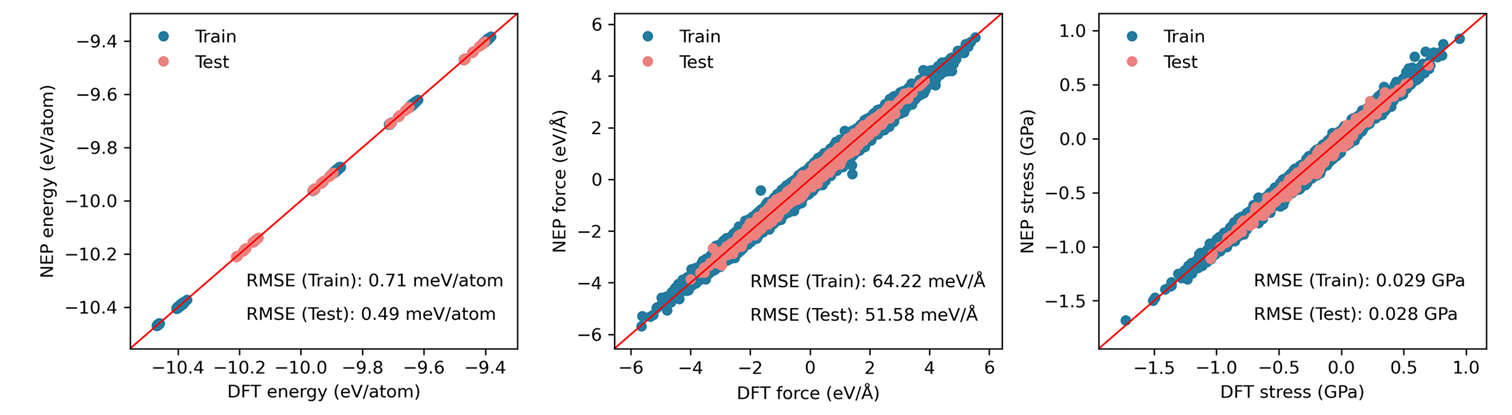
parity_density (plt_parity_density.py)
Generates density-based parity plots for energies, forces, and stresses. Useful for large datasets where scatter plots become unreadable.
Input Files: energy_train.out, force_train.out, and either
stress_train.out (preferred) or virial_train.out
gpumdkit.sh -plt parity_density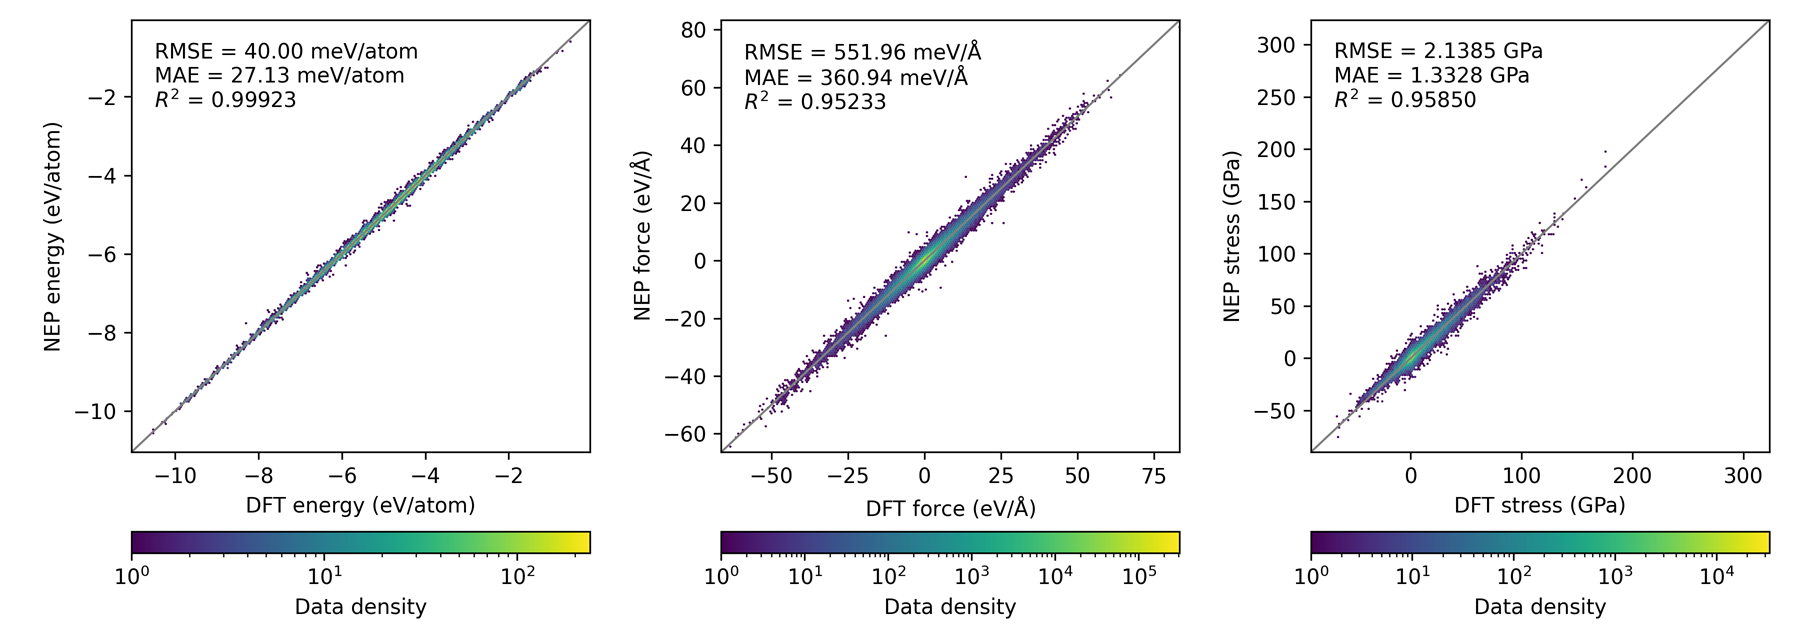
train_density (plt_train_density.py)
Generates density-based parity plots for NEP training results (energy, forces, stress or virial). Stress is preferred when both tensor files exist. Useful for large datasets where scatter plots become unreadable.
Input Files: energy_train.out, force_train.out, and either
stress_train.out (preferred) or virial_train.out
gpumdkit.sh -plt train_densityforce_errors (plt_force_errors.py)
Plots force error evaluation metrics as proposed by Liu et al..
Input File: force_train.out
Metrics Displayed: - Force magnitude errors (delta_F) - Force angle errors (delta_theta) - Distribution of errors
gpumdkit.sh -plt force_errors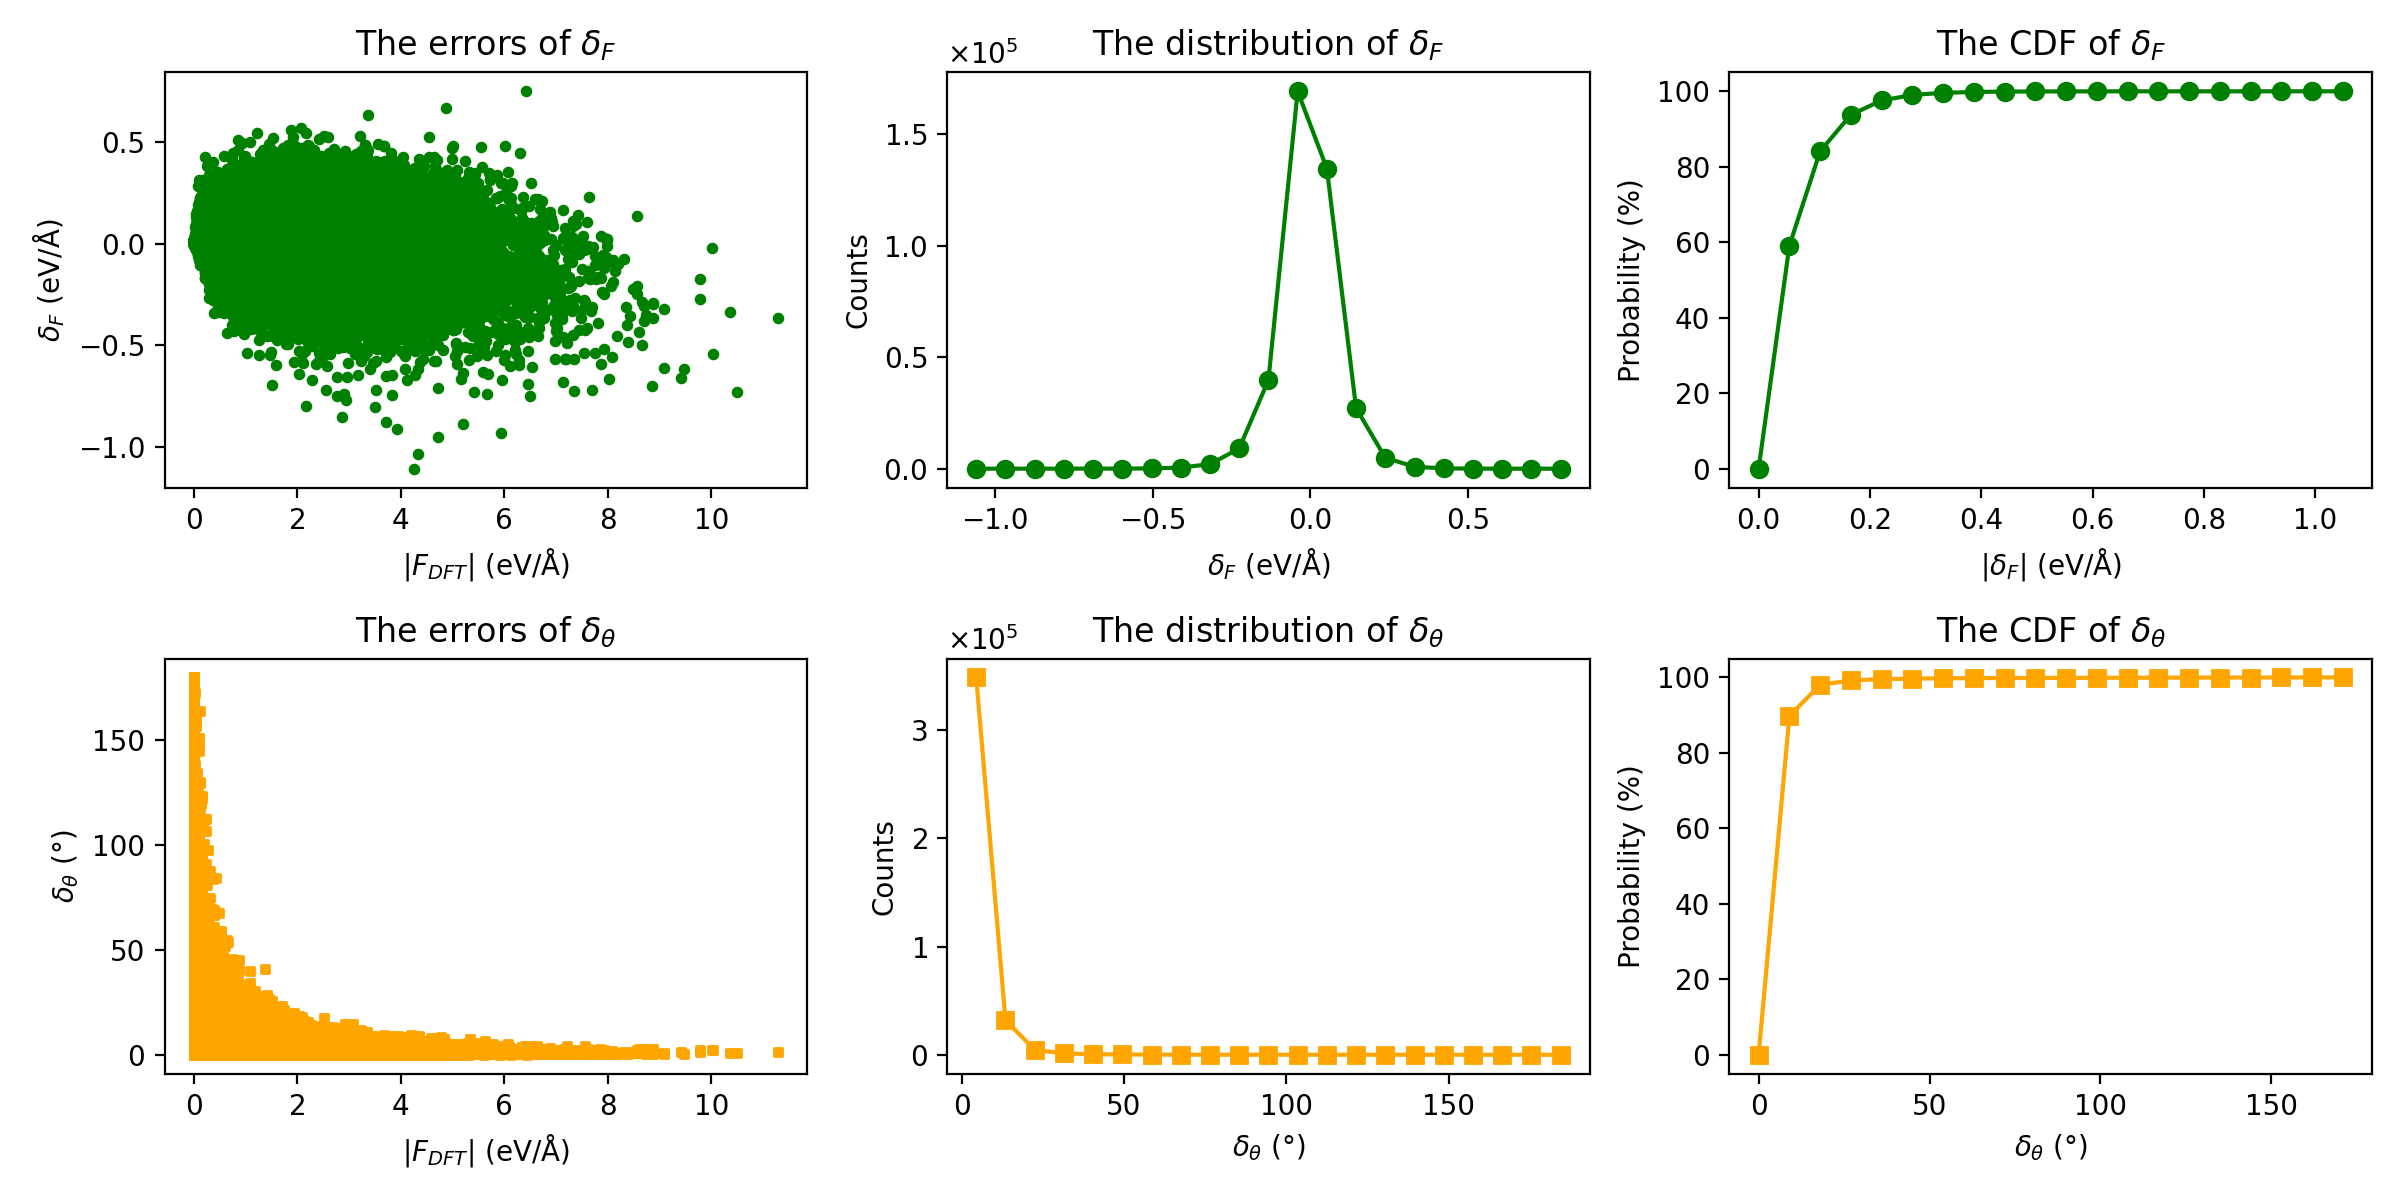
restart (plt_nep_restart.py)
Visualizes parameters stored in the nep.restart file. The file holds, for every parameter, the mean μ (top panel) and the standard deviation σ (bottom panel) of the search distribution used by the SNES optimizer.
Input File: nep.restart
gpumdkit.sh -plt restart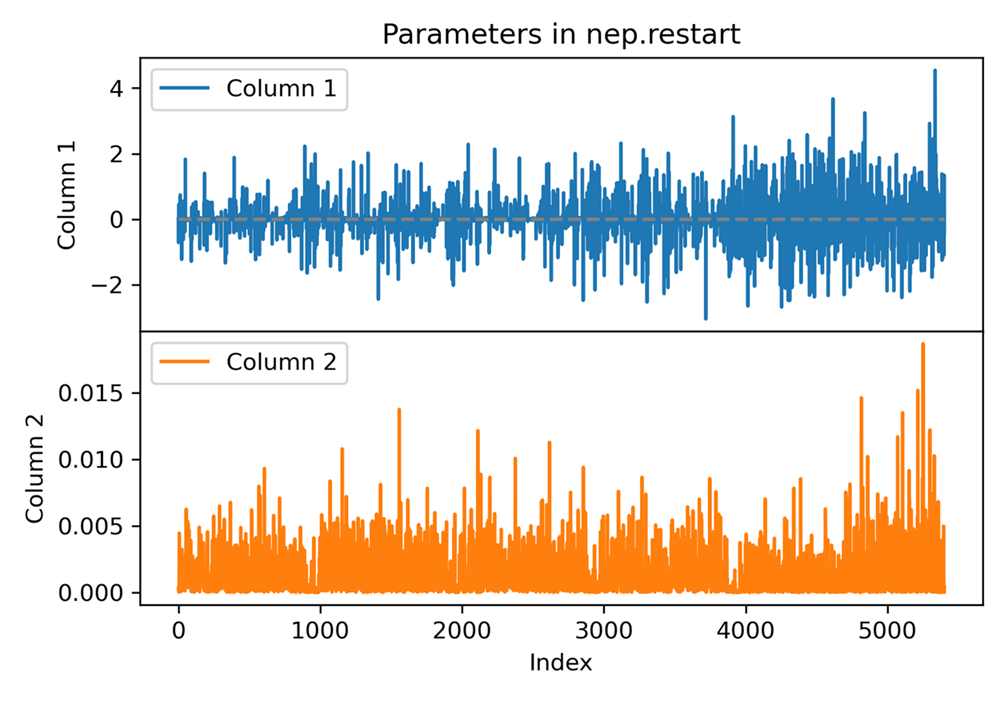
charge (plt_charge.py)
Plots charge distribution from qNEP model.
Input Files: train.xyz and charge_train.out
Important: Ensure consistency between training set and charge output atom ordering. Use full batch training or run prediction step first.
gpumdkit.sh -plt charge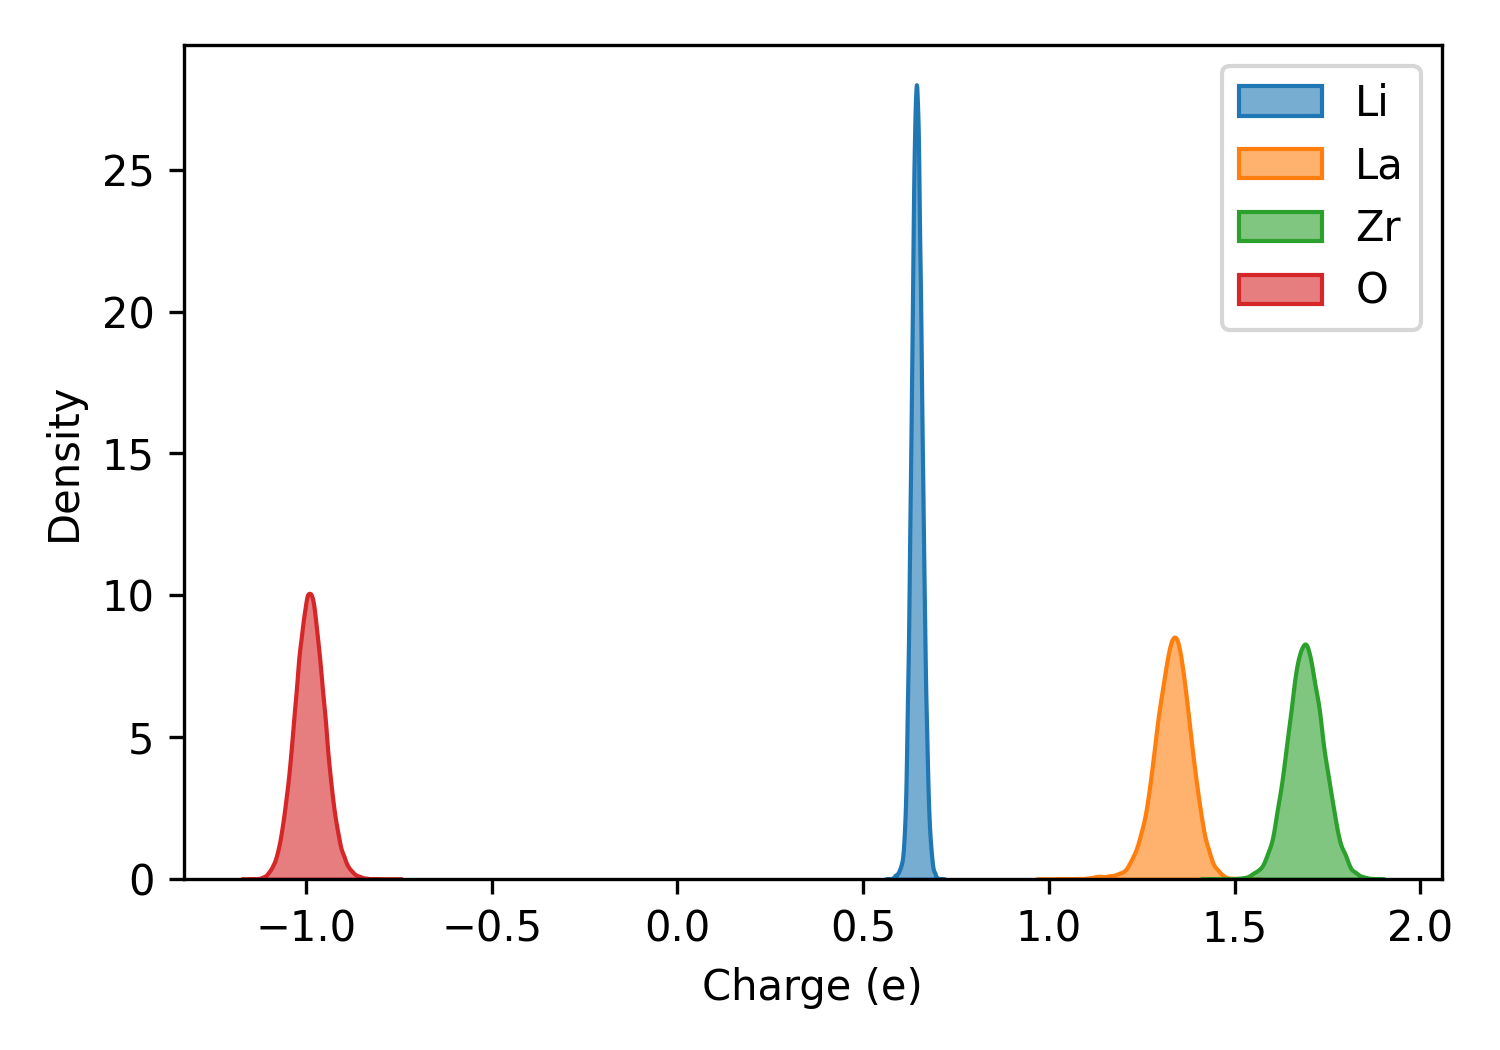
born_charge (plt_born_charge.py)
Creates parity plots for Born effective charges (BEC) on training and testing datasets. Structures with all-zero reference BEC are filtered out.
Input Files: bec_train.out; optional bec_test.out
gpumdkit.sh -plt born_charge
gpumdkit.sh -plt bec          # Alternative command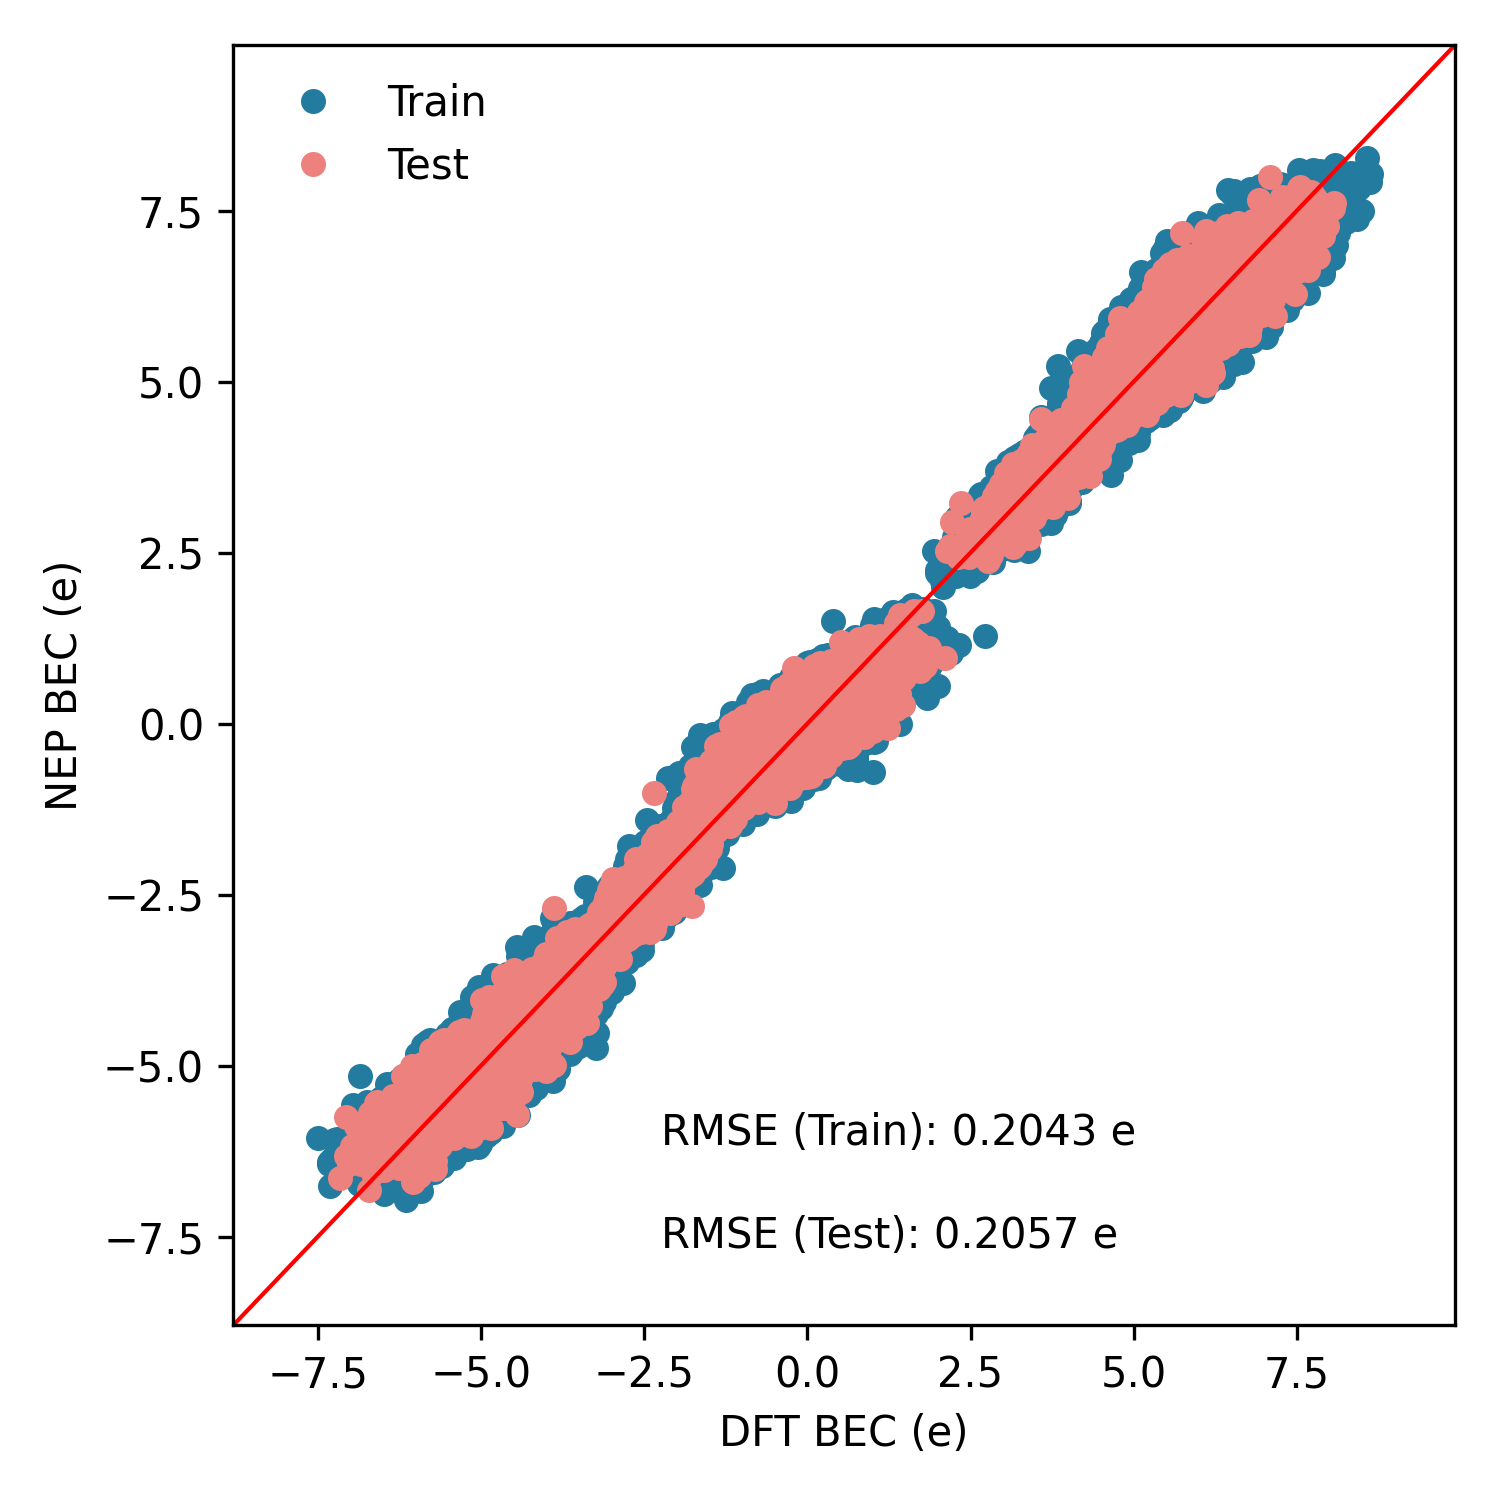
Descriptor, Dimer, and Extra Analysis
des (plt_descriptors.py)
Visualizes high-dimensional NEP descriptors using dimensionality reduction (PCA or UMAP).
Input File: descriptors.npy (generated by gpumdkit.sh -calc des)
Methods:
- pca — Principal Component Analysis
- umap — Uniform Manifold Approximation and Projection
# First generate descriptors
gpumdkit.sh -calc des train.xyz descriptors.npy nep.txt Li

# Then visualize
gpumdkit.sh -plt des pca descriptors.npy
gpumdkit.sh -plt des umap descriptors.npy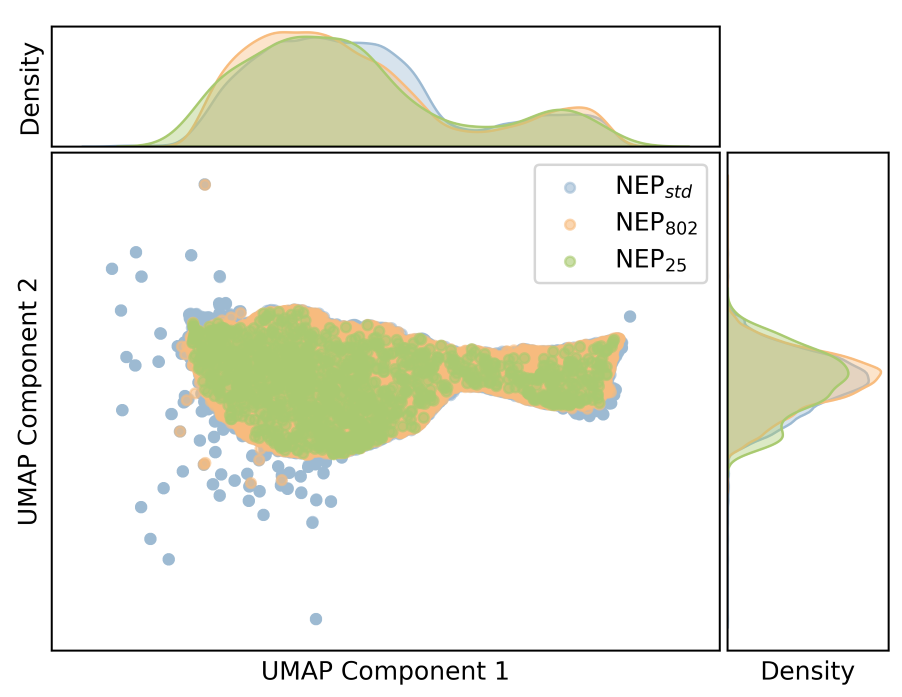
dimer (plt_dimer.py)
Plots dimer interaction curves. Two atoms are placed in a cubic box (30 Å) and the potential energy and force are calculated as a function of dimer distance using a NEP model.
Input File: nep.txt
gpumdkit.sh -plt dimer <element1> <element2> <nep.txt> [save]
gpumdkit.sh -plt dimer Li Li nep.txt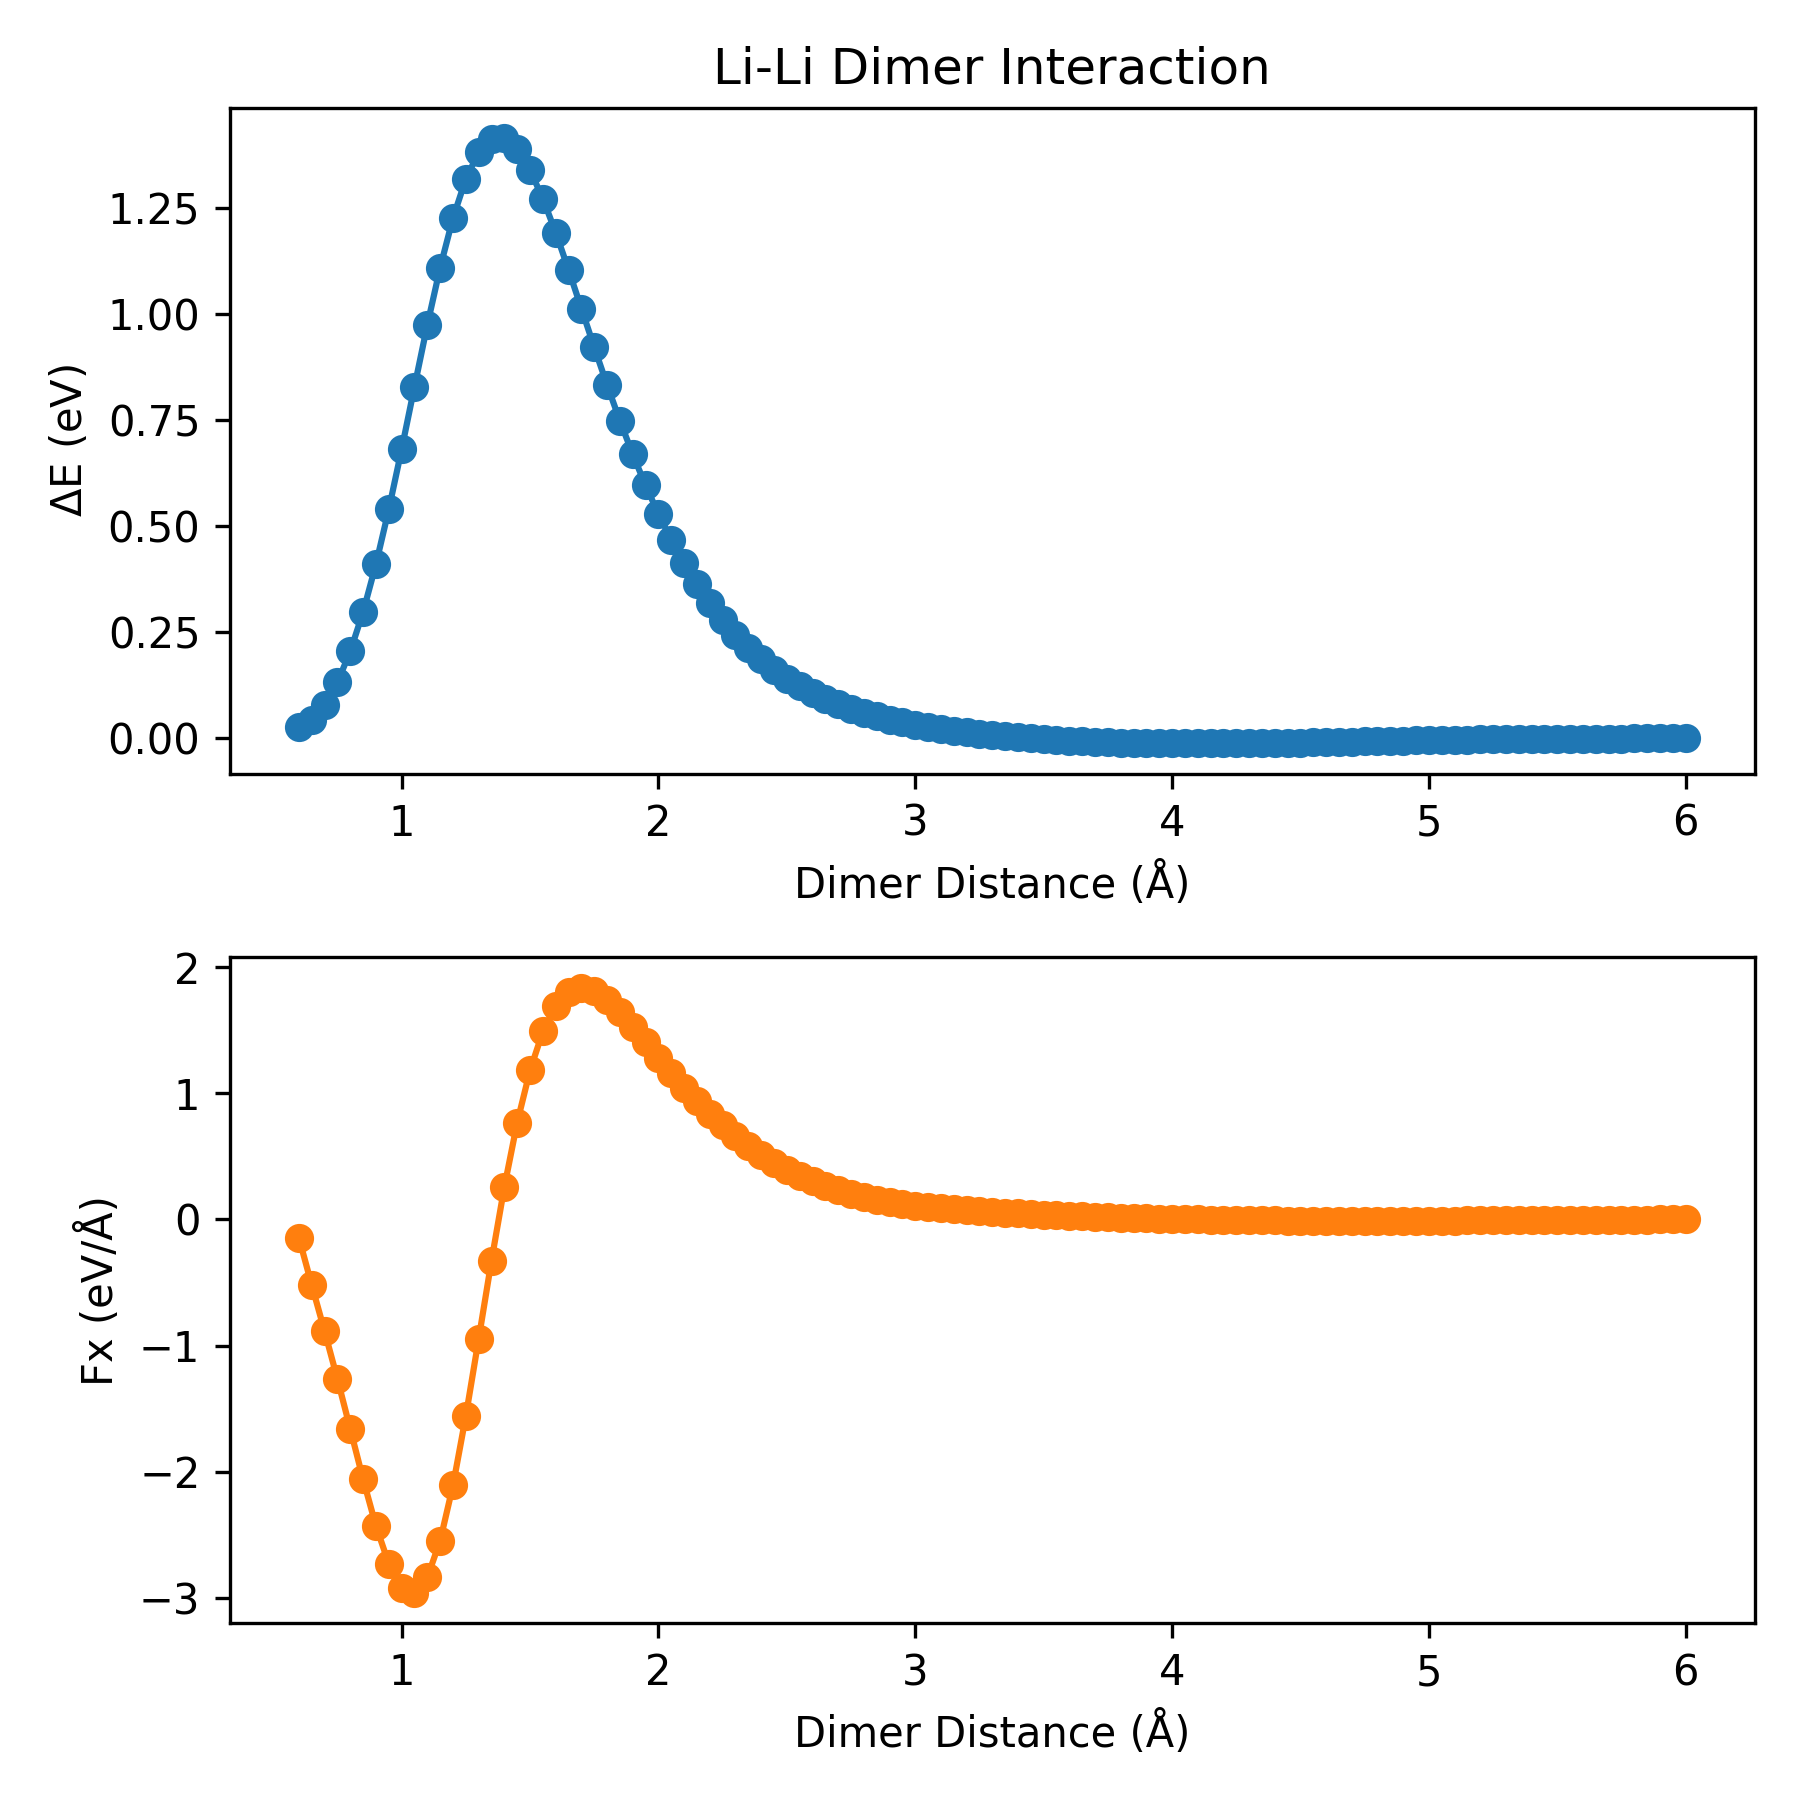
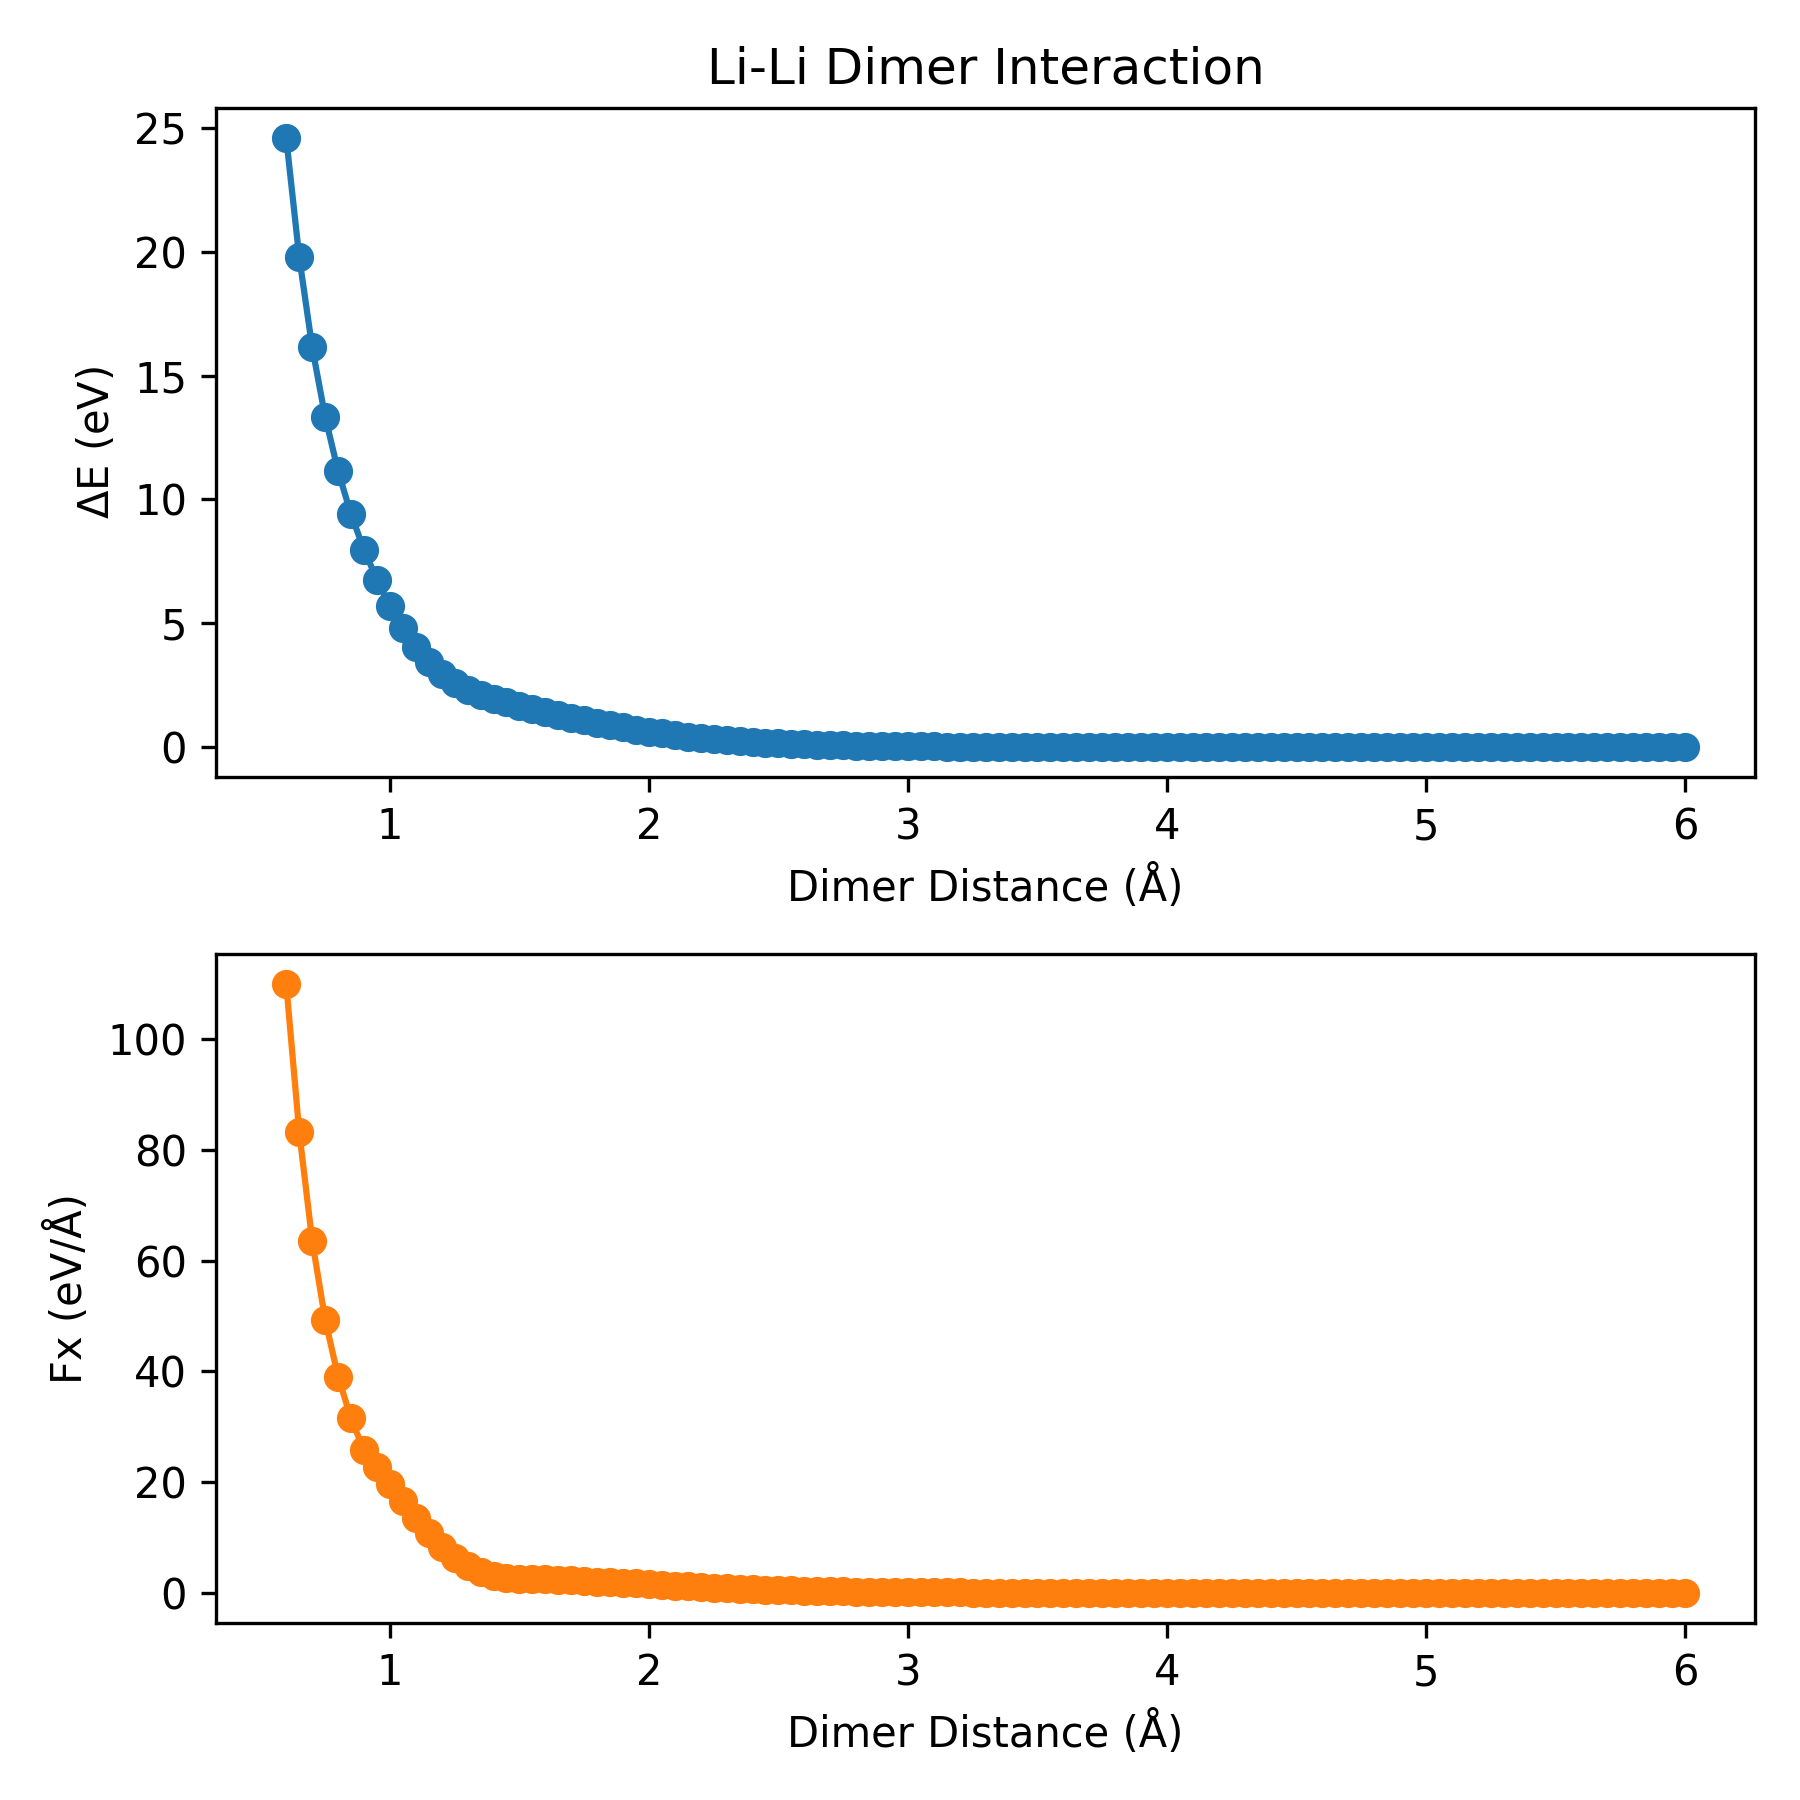
Li-Li dimer curves from the same NEP model without ZBL (left) and with ZBL (right), from 0.5 to 6 Å. Without ZBL the energy and force oscillate at short distance because that region lies outside the training data; with ZBL the short-range repulsion rises smoothly.
Reference: J. Chem. Inf. Model. 2026, 66, 3, 1406-1413
doas (plt_doas.py)
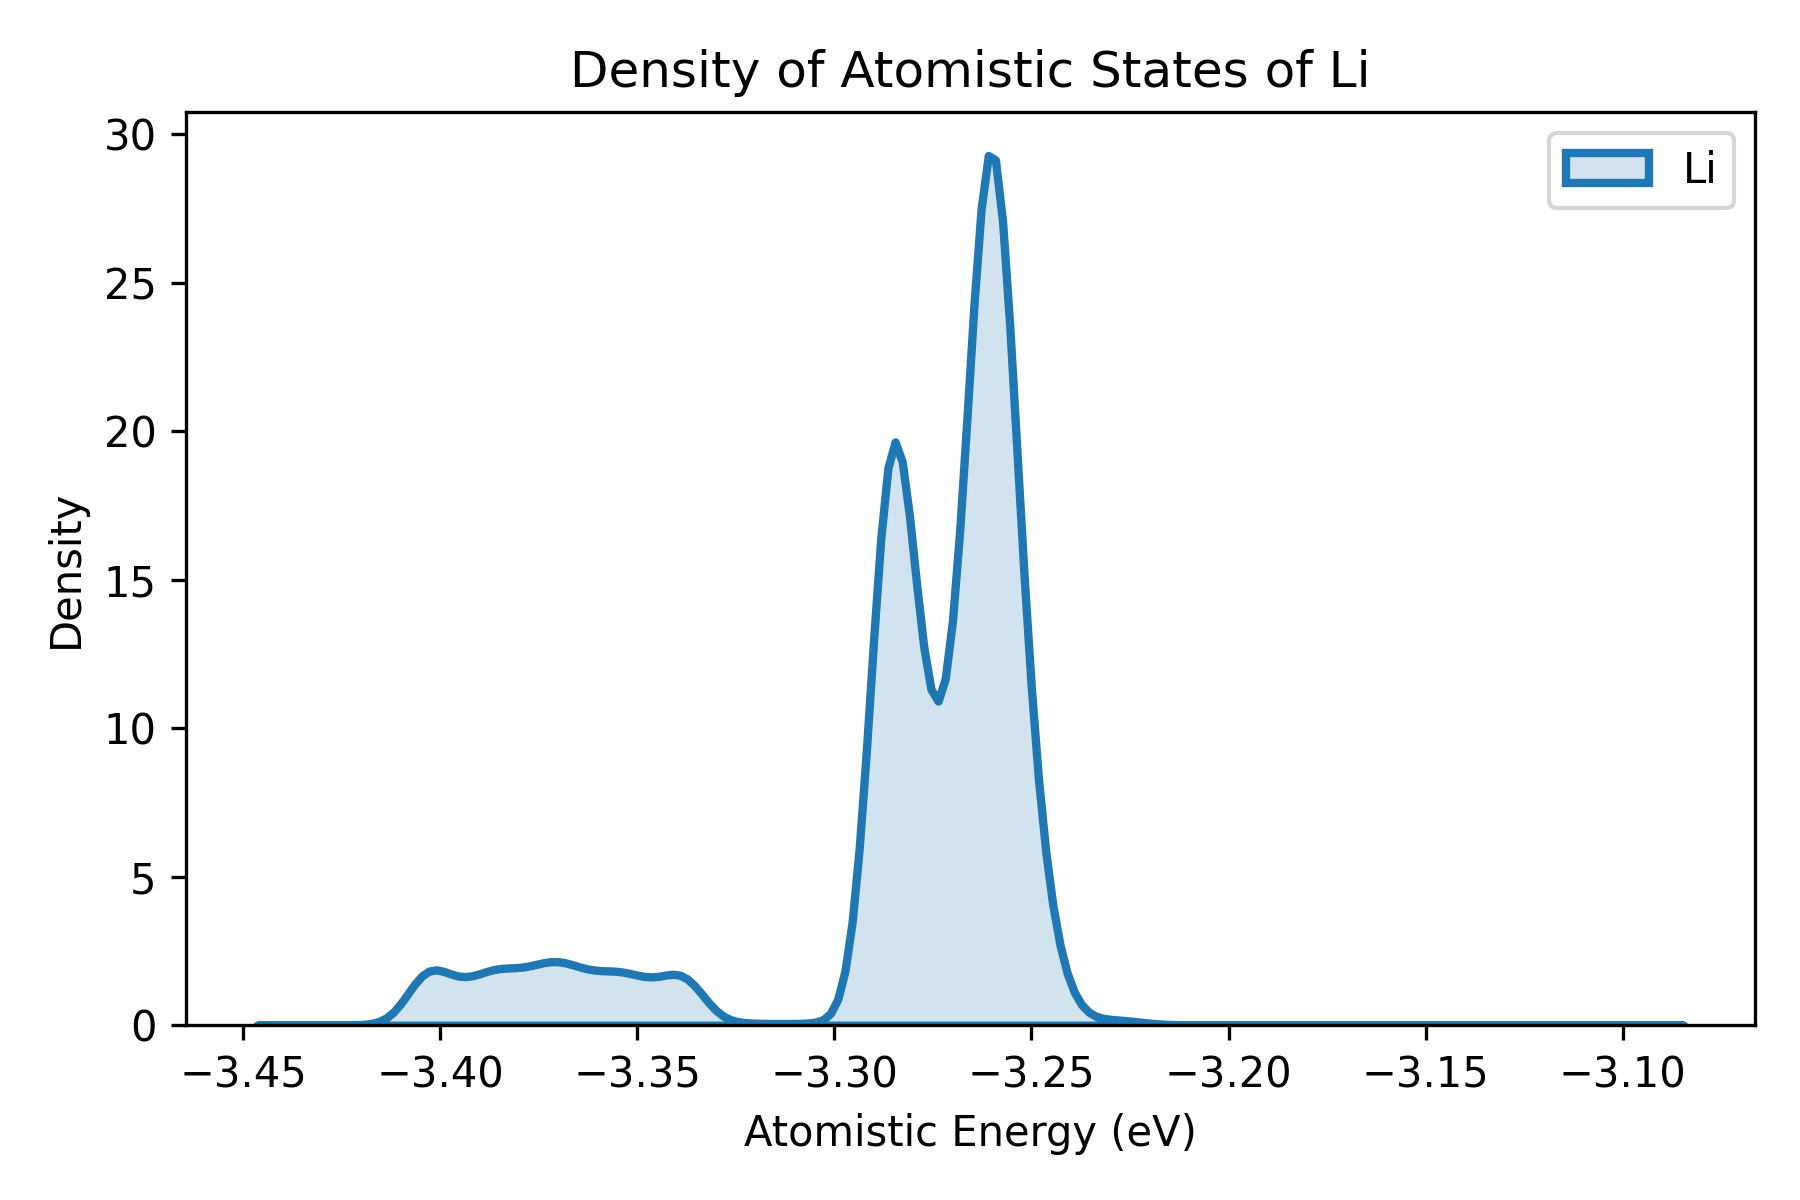
Plots density of atomistic states (DOAS) proposed by Wang et al..
Input File: doas.out (calculated by gpumdkit.sh -calc doas)
gpumdkit.sh -plt doas <doas.out> <species>
gpumdkit.sh -plt doas doas.out Li